“These examples do not represent an exhaustive list of input received by the Department,” the department wrote on its website last week. “The Department is continuing to give publishers the opportunity to remediate all deficiencies identified during the review to ensure the broadest selection of high-quality instructional materials are available to the school districts and Florida’s students.”
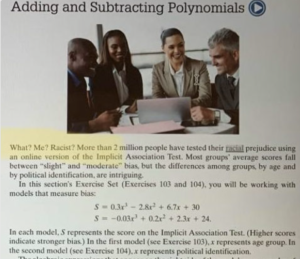
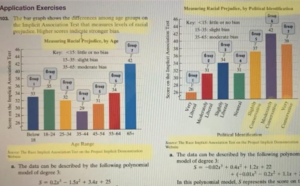
In one image, bar graphs measure racial prejudice by age and political identification on an Implicit Association Test, a test used to detect peoples’ implicit biases.

Under a section that seems to be linked to the graphs about “Adding and Subtracting Polynomials,” the text reads, “What? Me? Racist? More than 2 million people have tested their racial prejudice using an online version of the Implicit Association Test. Most groups’ average scores fall between ‘slight’ and ‘moderate’ bias, but the differences among groups … are intriguing.”


